Clouds
A major focus of CAESAR is to better understand the clouds and precipitation that form above the open ocean during cold air outbreaks. Polar orbiting satellites provide a beautiful insight into the wide range of cloud types that are present.
During one of our research flights we flew straight north from Kiruna toward the island of Svalbard and sampled a transect just south of the island at 76°N. The image below shows an overpass of the NOAA 21 polar orbiting satellite that is equipped with the Visible Infrared Imaging Radiometer Suite (VIIRS) suite. A big advantage of polar orbiting satellites is that they provide high spatial resolution (350 m), which in turn allows imaging of cloud cells that are organized on scales of a few km. A big disadvantage is that satellite images over the same area are only available a few times per day.
In the image below, the overpass occurred at 0805 UTC, which was perfectly timed with the arrival of the C-130 to sample clouds..
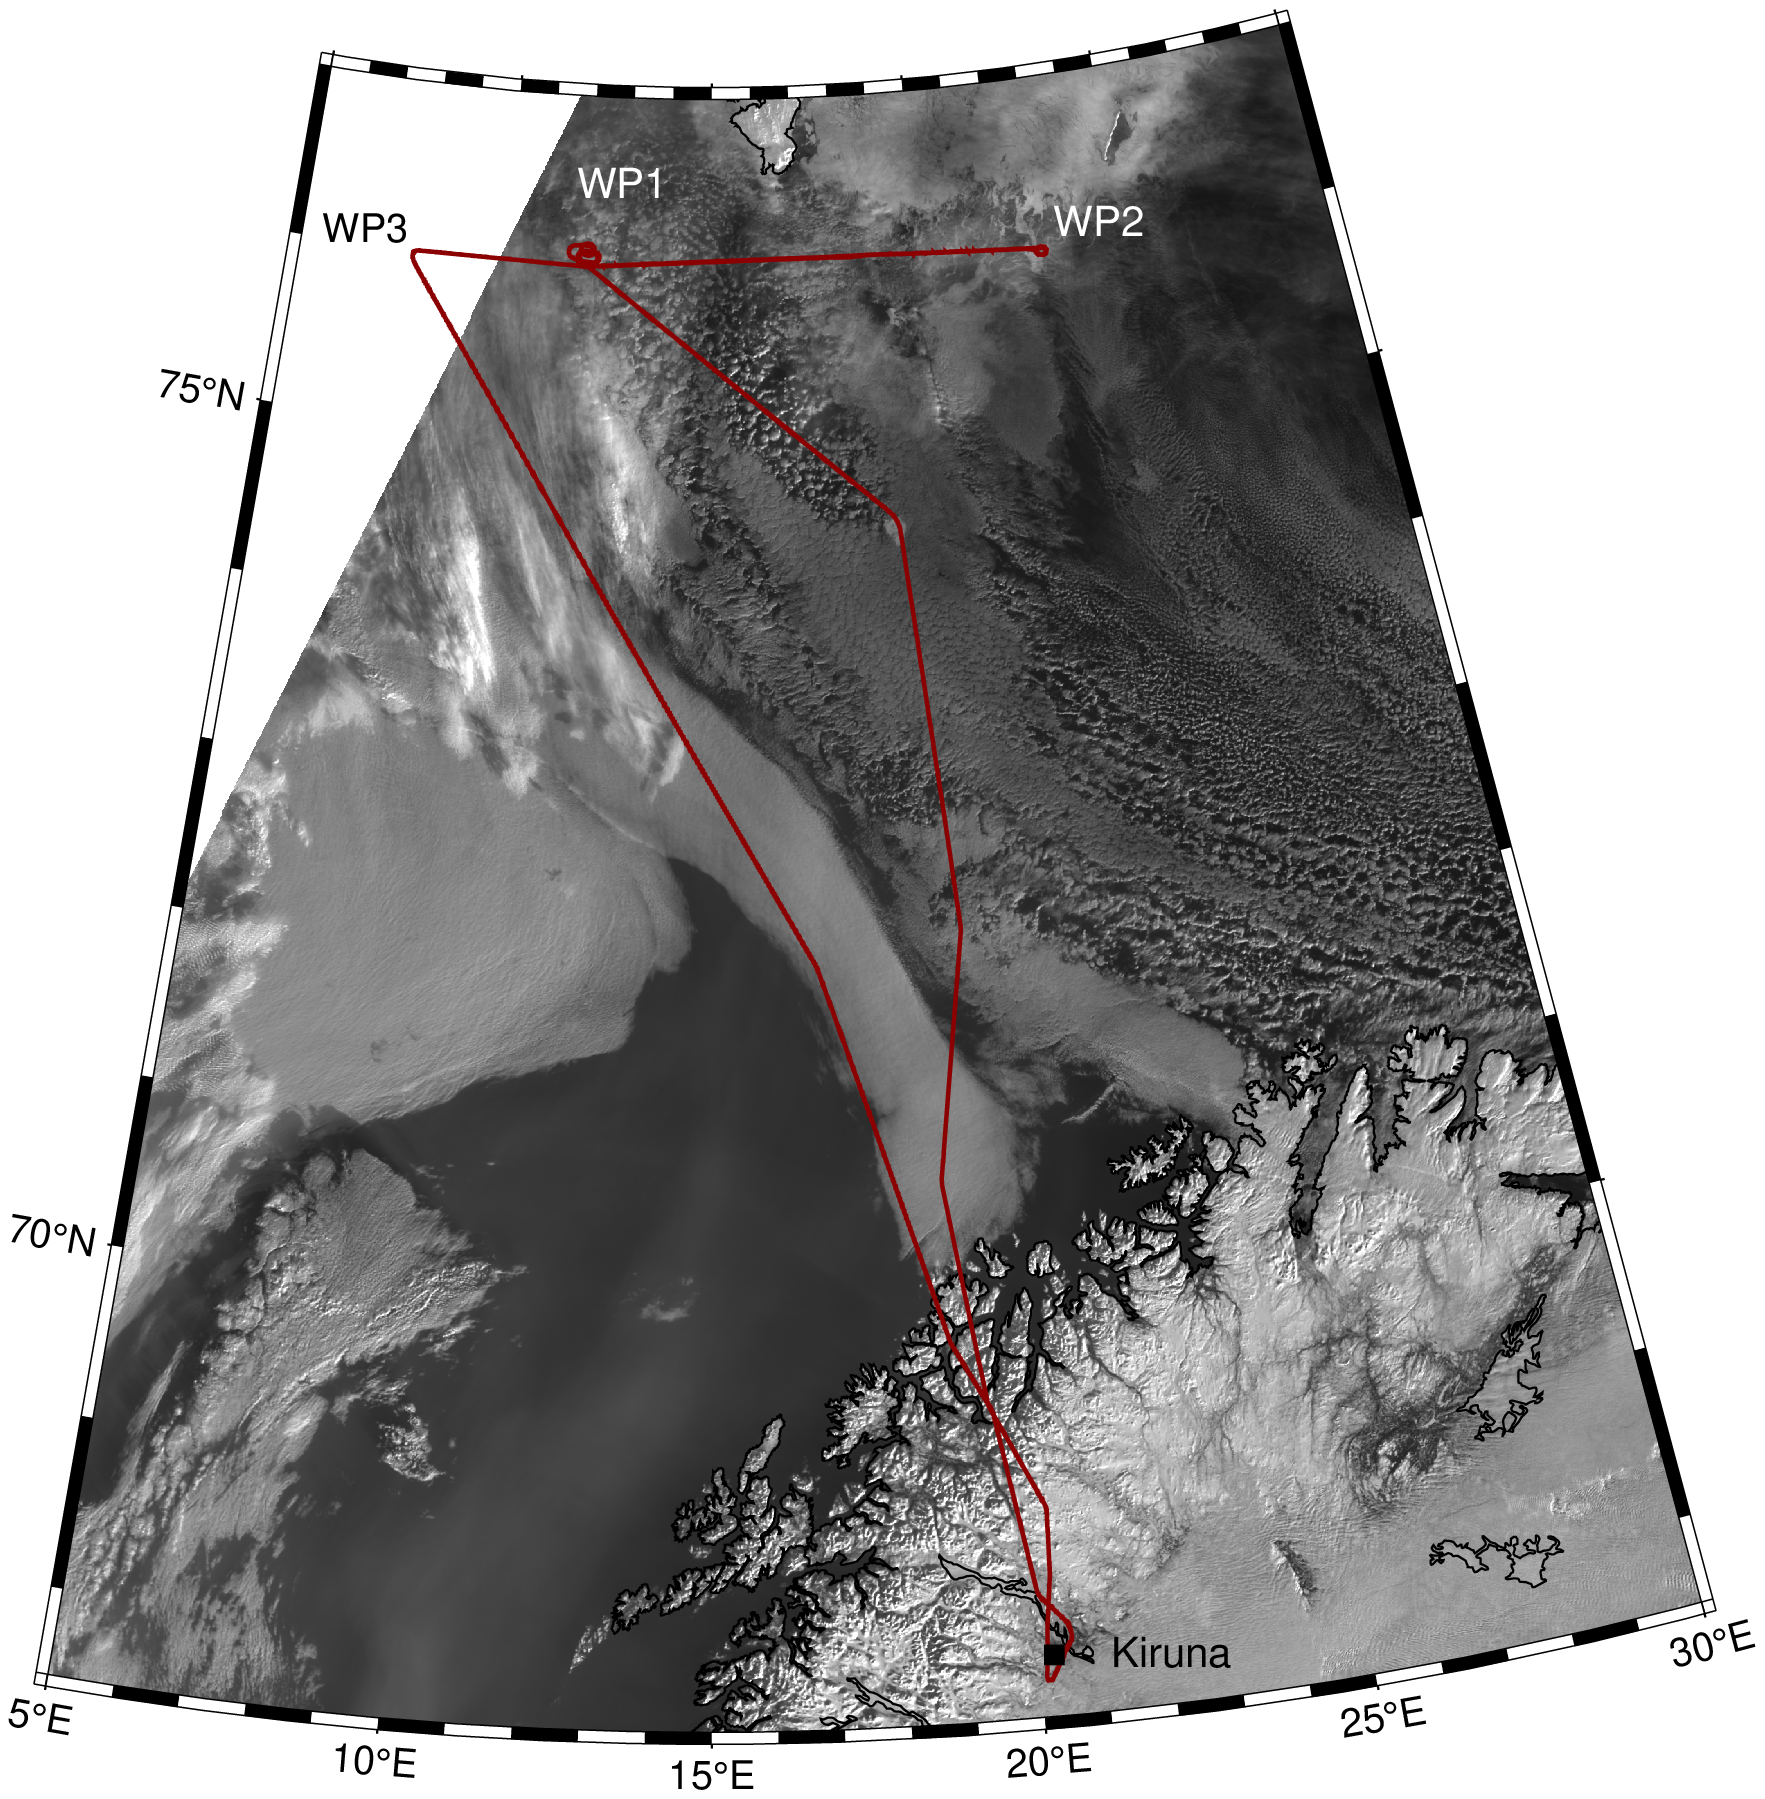
Figure 1. Reflectivity sampled by the NOAA-21 VIIRS channel 1 sensor at 08:05 UTC. The image shows snow cover over the continents, regions of cloud free ocean, regions of closed cellular convection, regions of open cellular convection, regions of solid high cloud cover, and regions cloud cover mixed with marginal sea ice. The red line corresponds to the flight track.
The flight track took the plane from Kiruna to WP1 (Way Point 1) flying at high altitude. At WP1 the C-130 did a spiral descent to take a vertical profile of the atmosphere, followed by a low flight leg near the ocean surface toward WP2. At WP2, the C-130 did a spiraled ascent to then few to WP3 near cloud top/just above the cloud layer. Finally, the air plane returned to Kiruna, also flying above the clouds.
The figure below shows a zoomed in view of the flight track between WP2 and WP3.
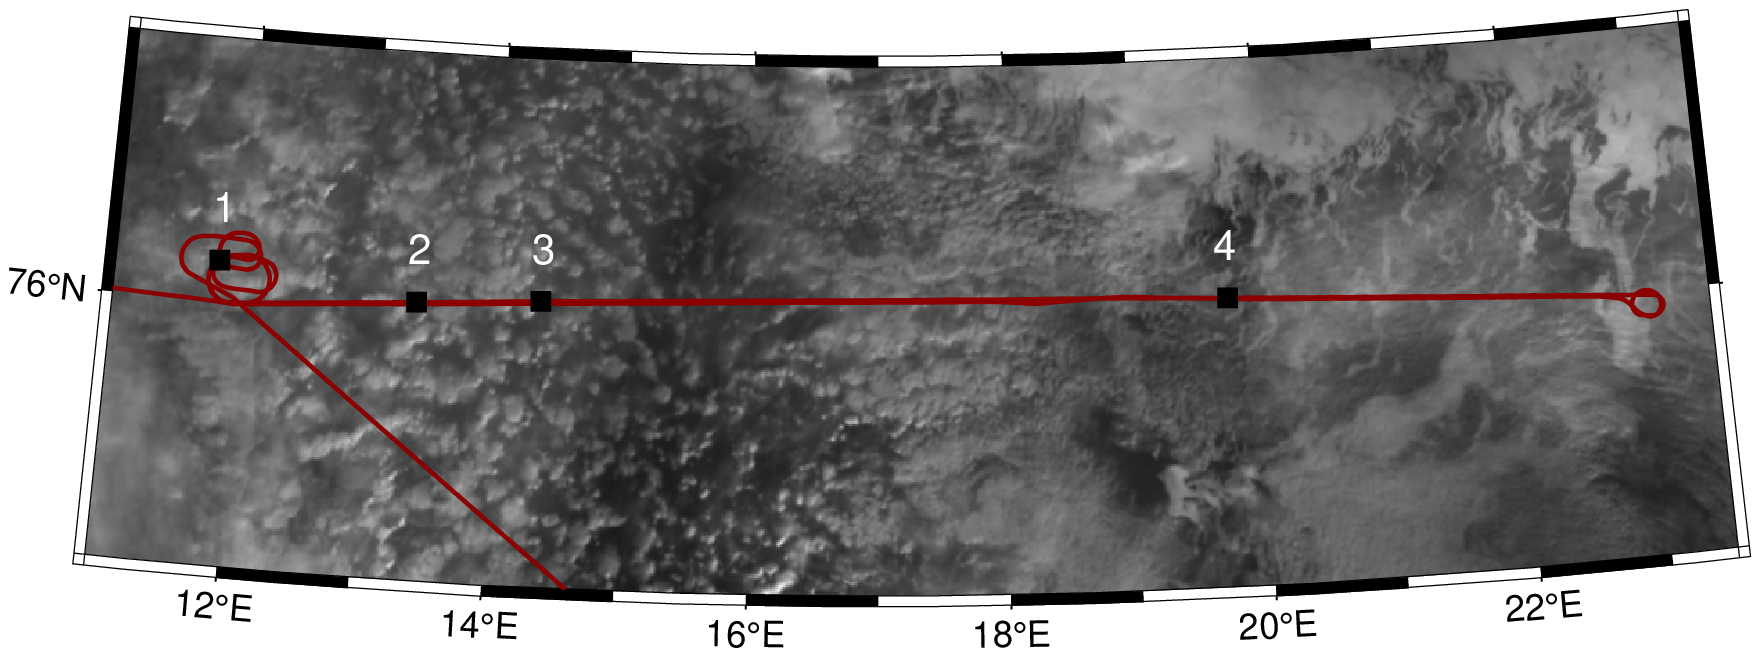
| 1: 08:11 UTC | 2: 08:30 UTC | 3: 08:34 UTC | 4: 08:56 UTC |
|---|---|---|---|
 | 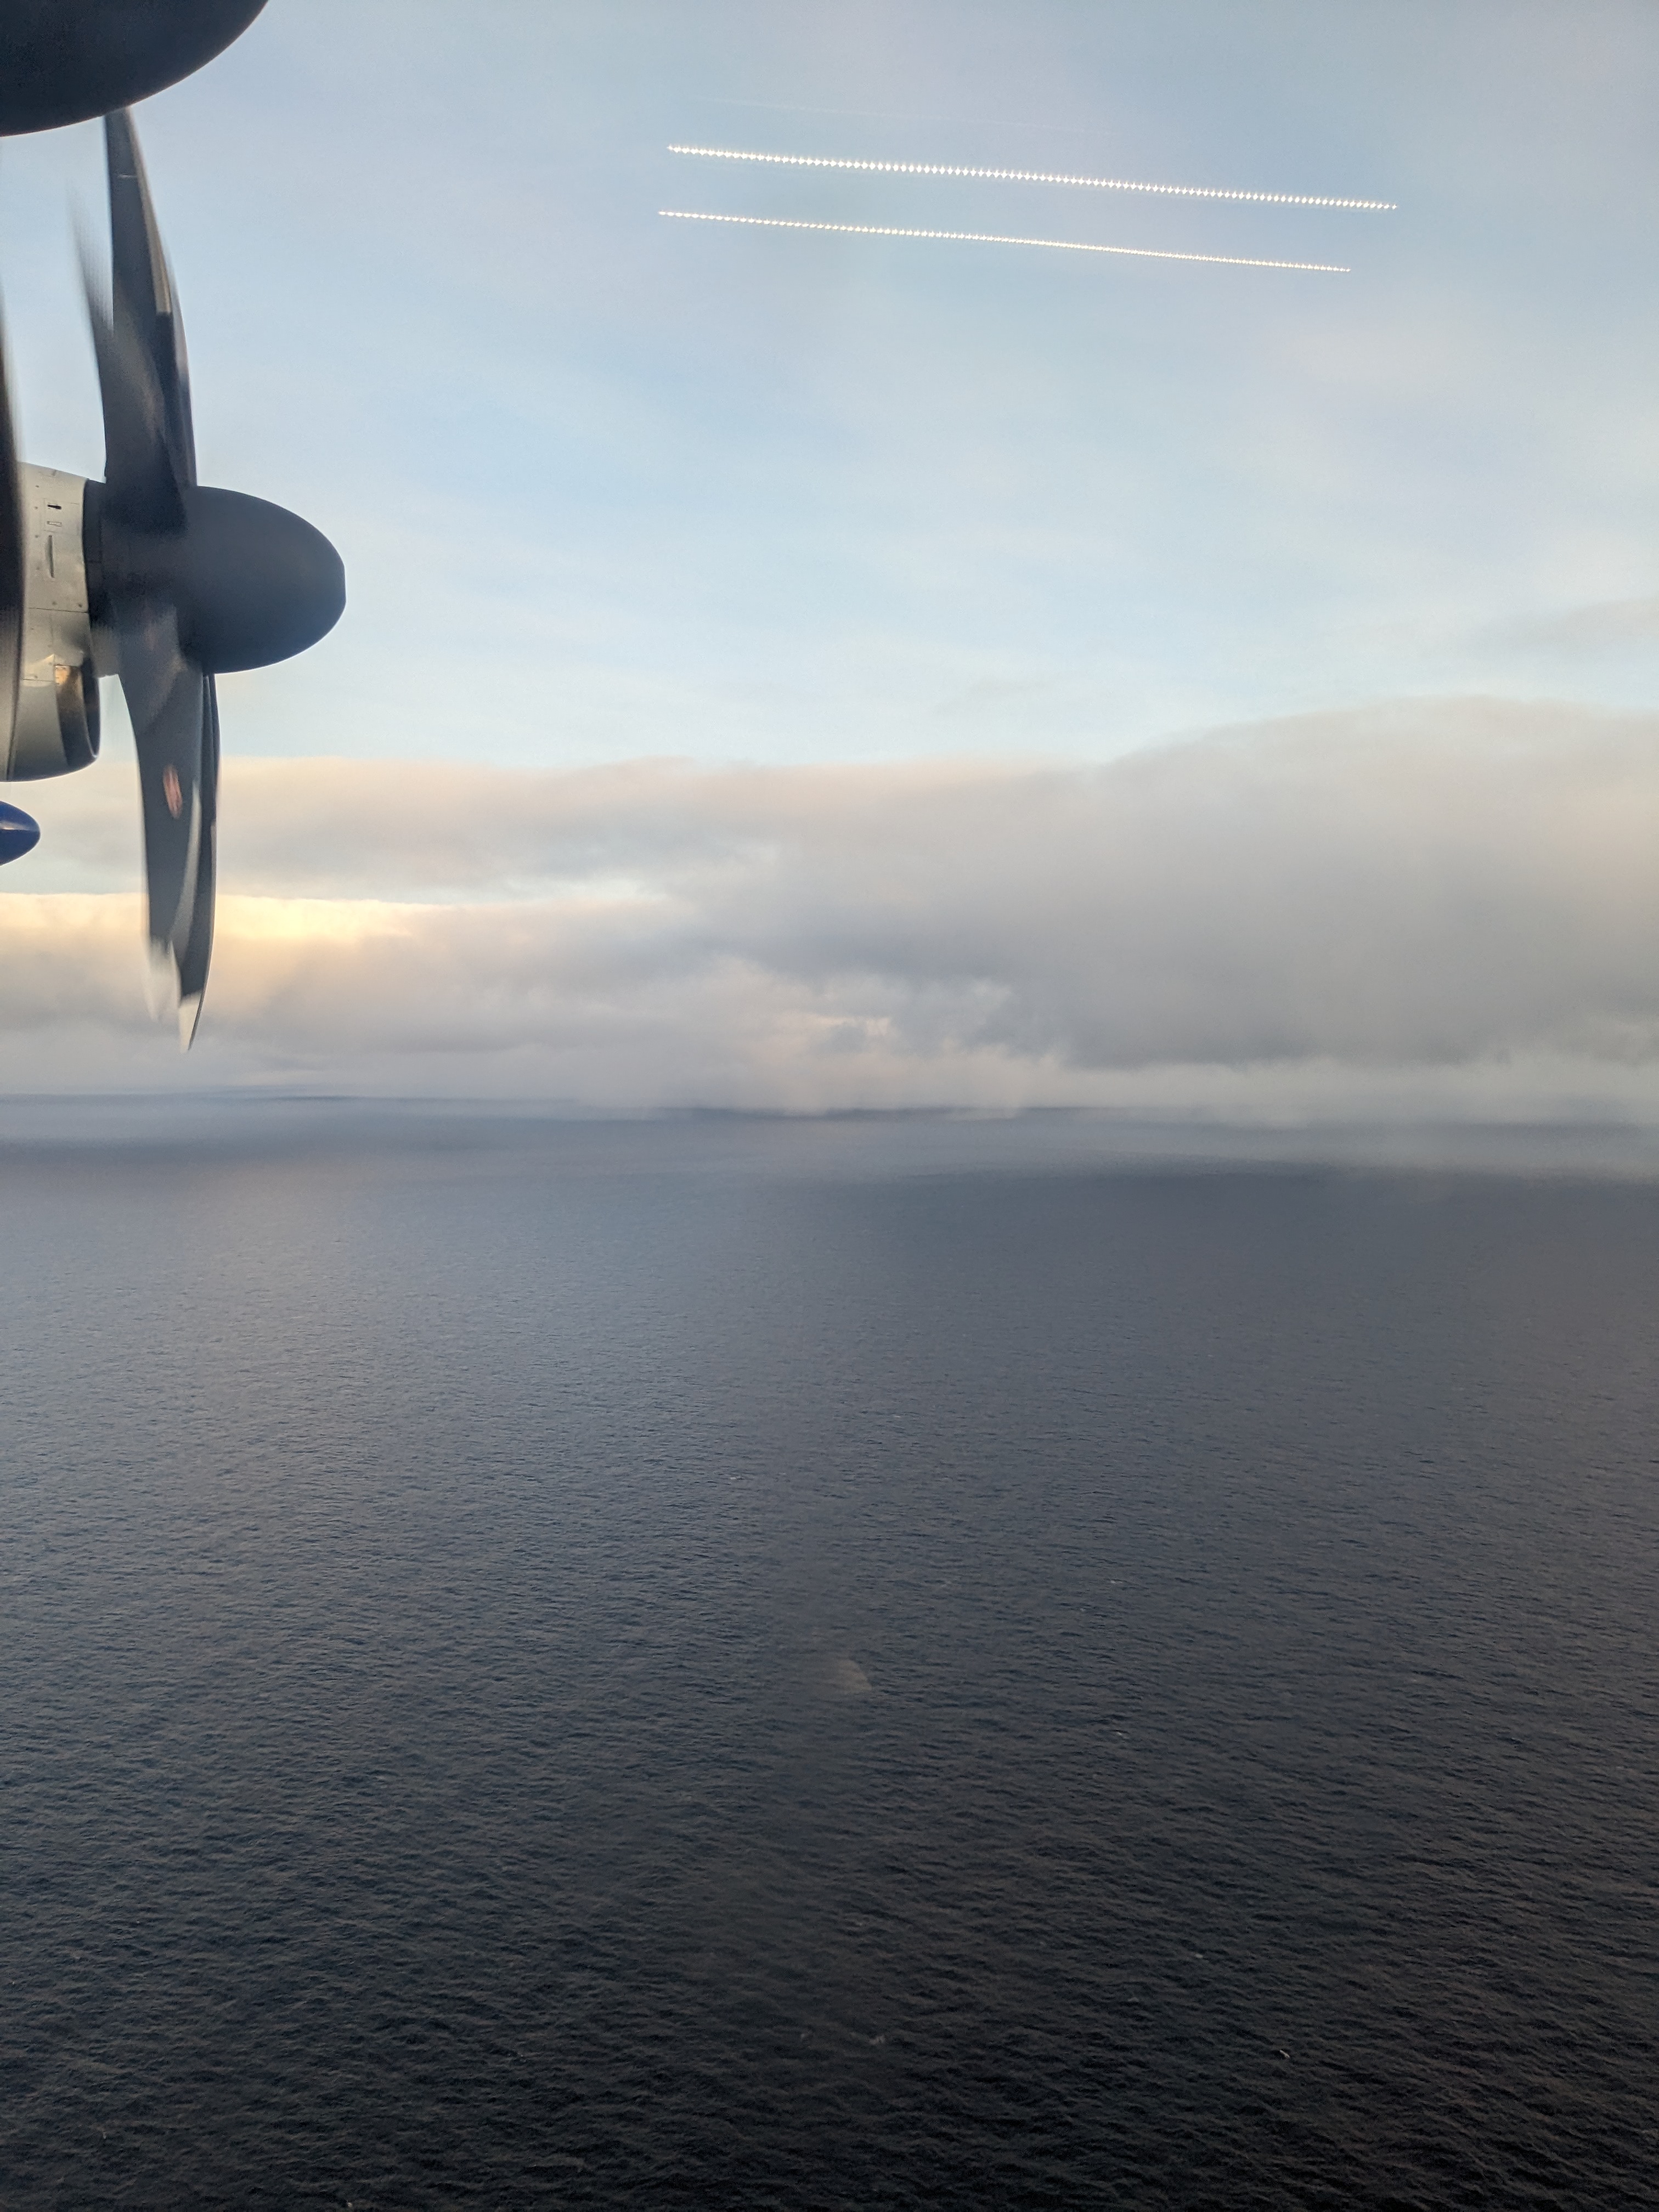 | 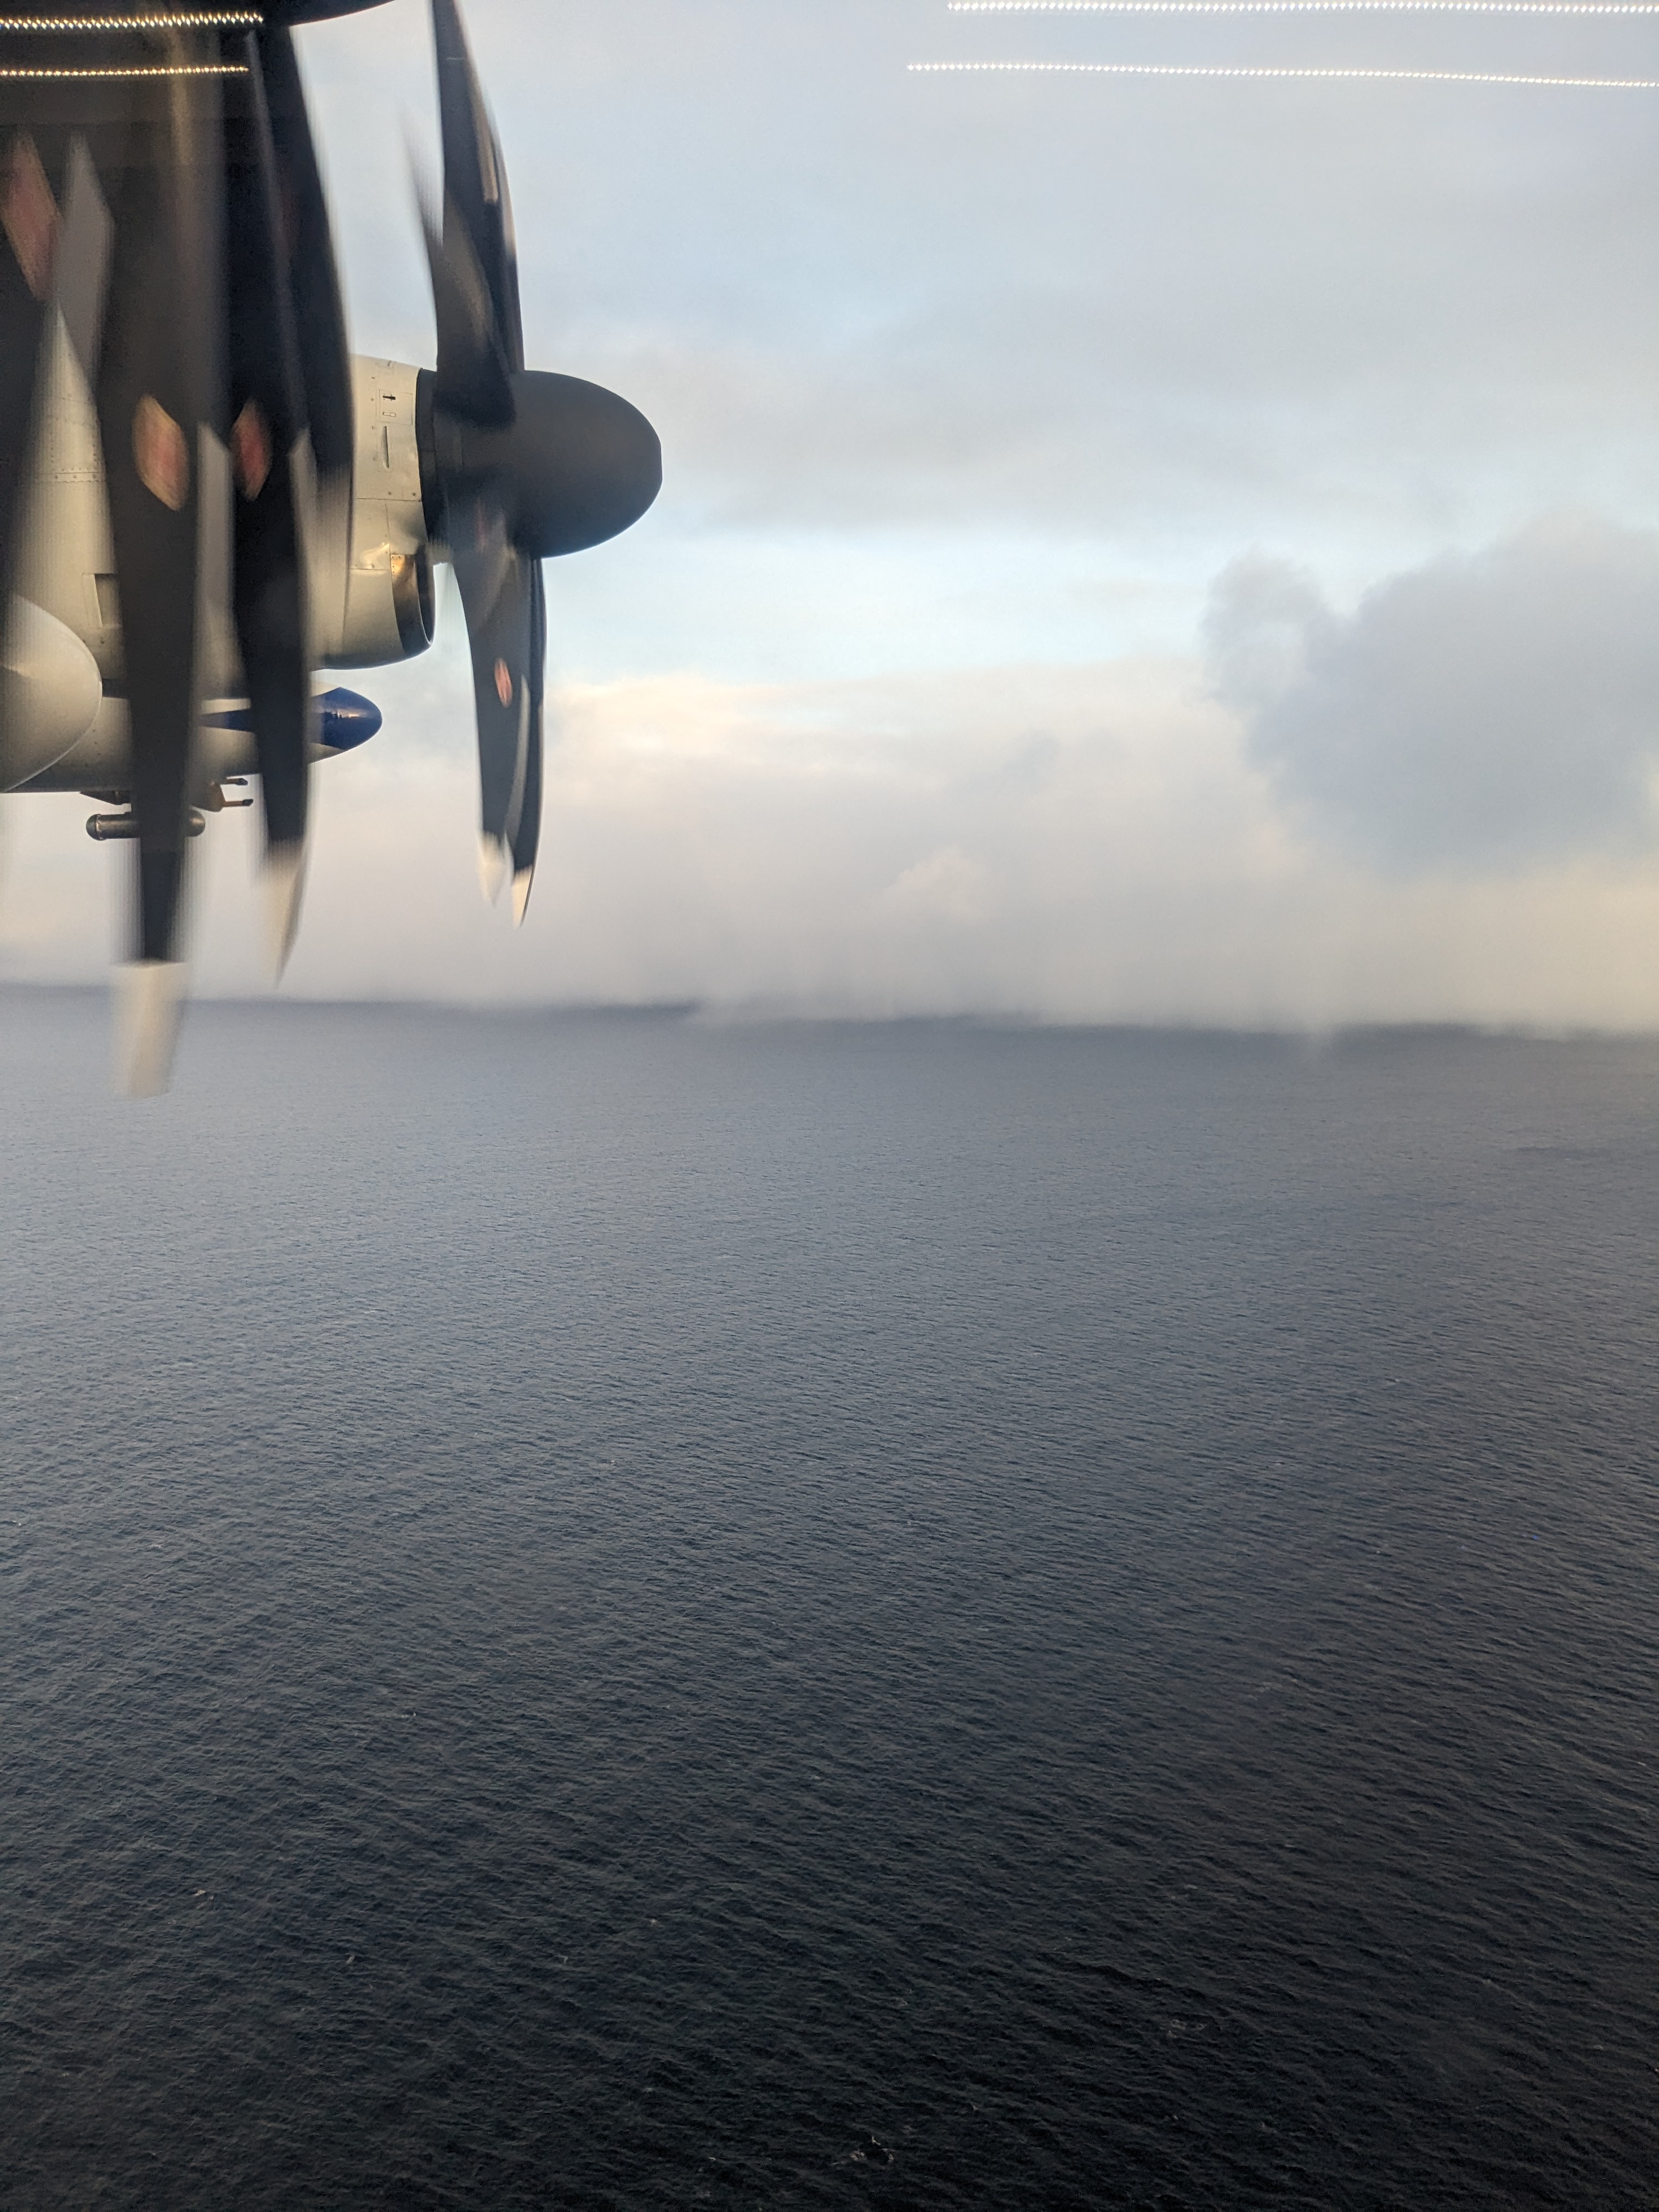 | 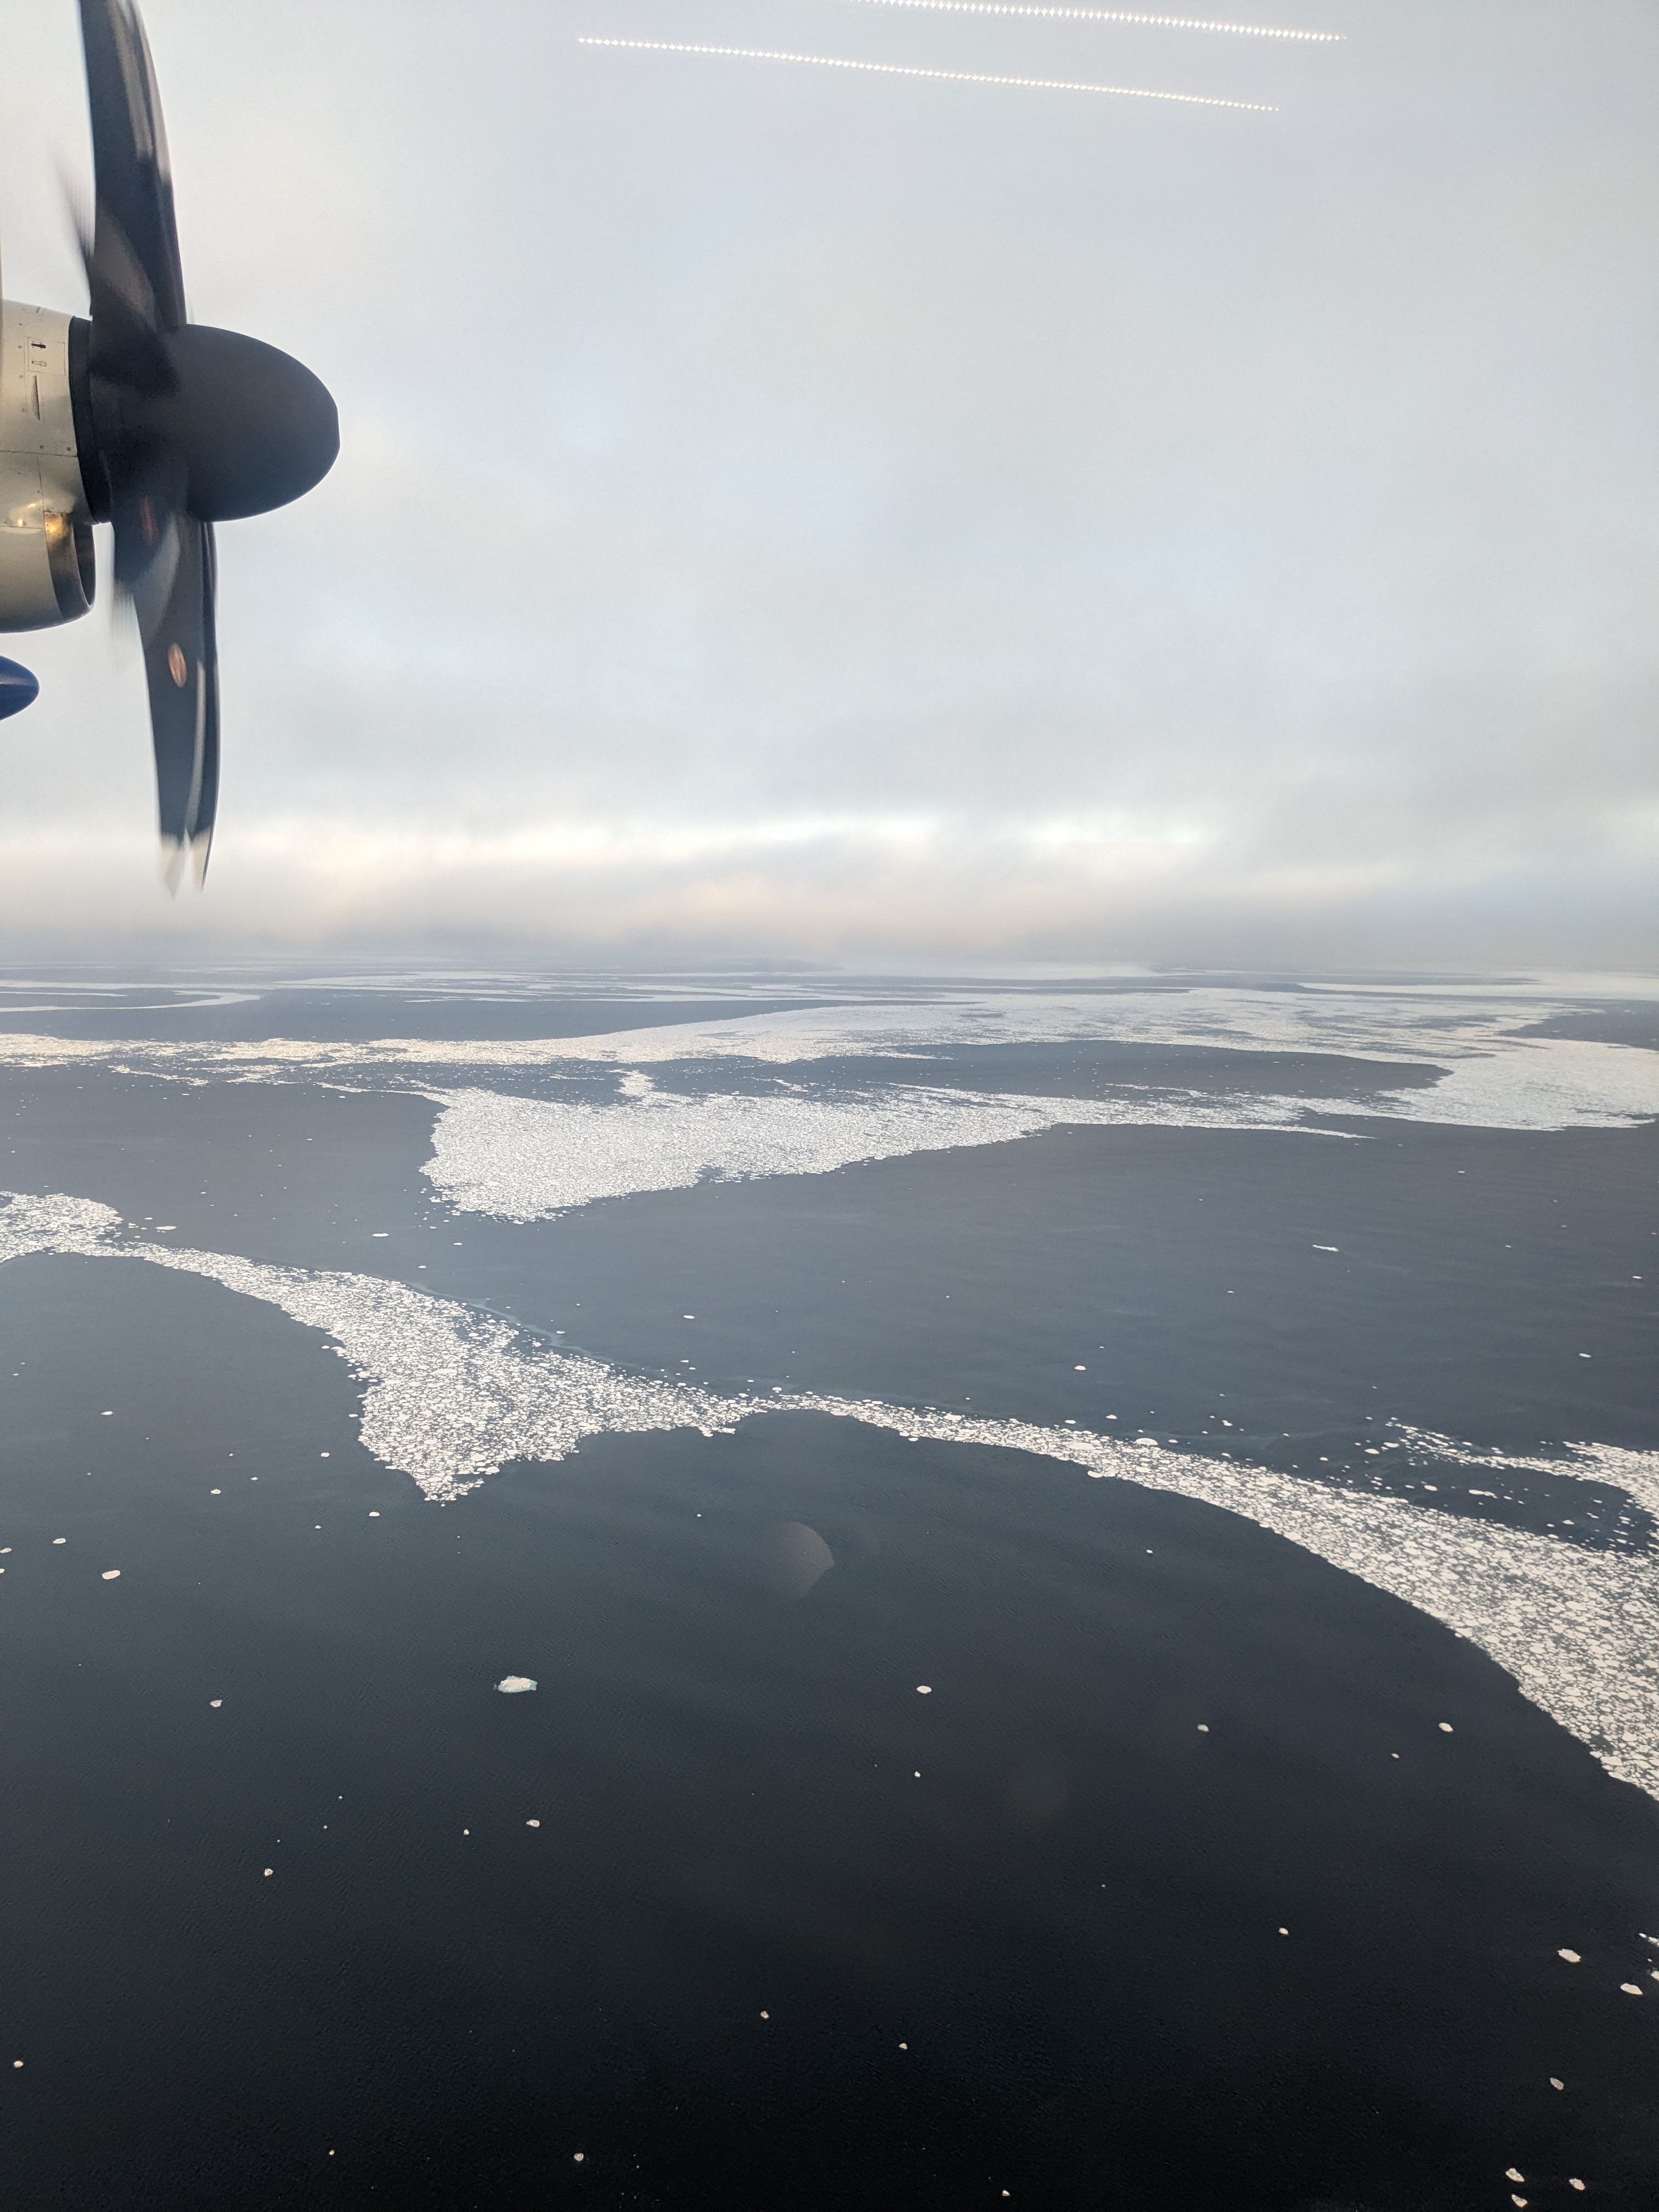 |
Figure 2. Imagery from the NOAA-21 VIIRS channel 1 sensor at 08:05 UTC. Symbols show the location of the plane from where the pictures were taken. Picture 1 was taken just before the spiral descent. Pictures 2-4 were taken along the surface leg between WP2 and WP3.
The pictures show the cellular structure of the clouds. There are regions that are cloud free, regions that have cloud cover but no precipitation, regions that are heavily precipitating. Toward the East, the pictures show the marginal ice under the cloud, which is also visible in the satellite image.
The figures below show conditions from above the cloud, through the clouds that cap the marine boundary layer, and lower into the below-cloud zone.
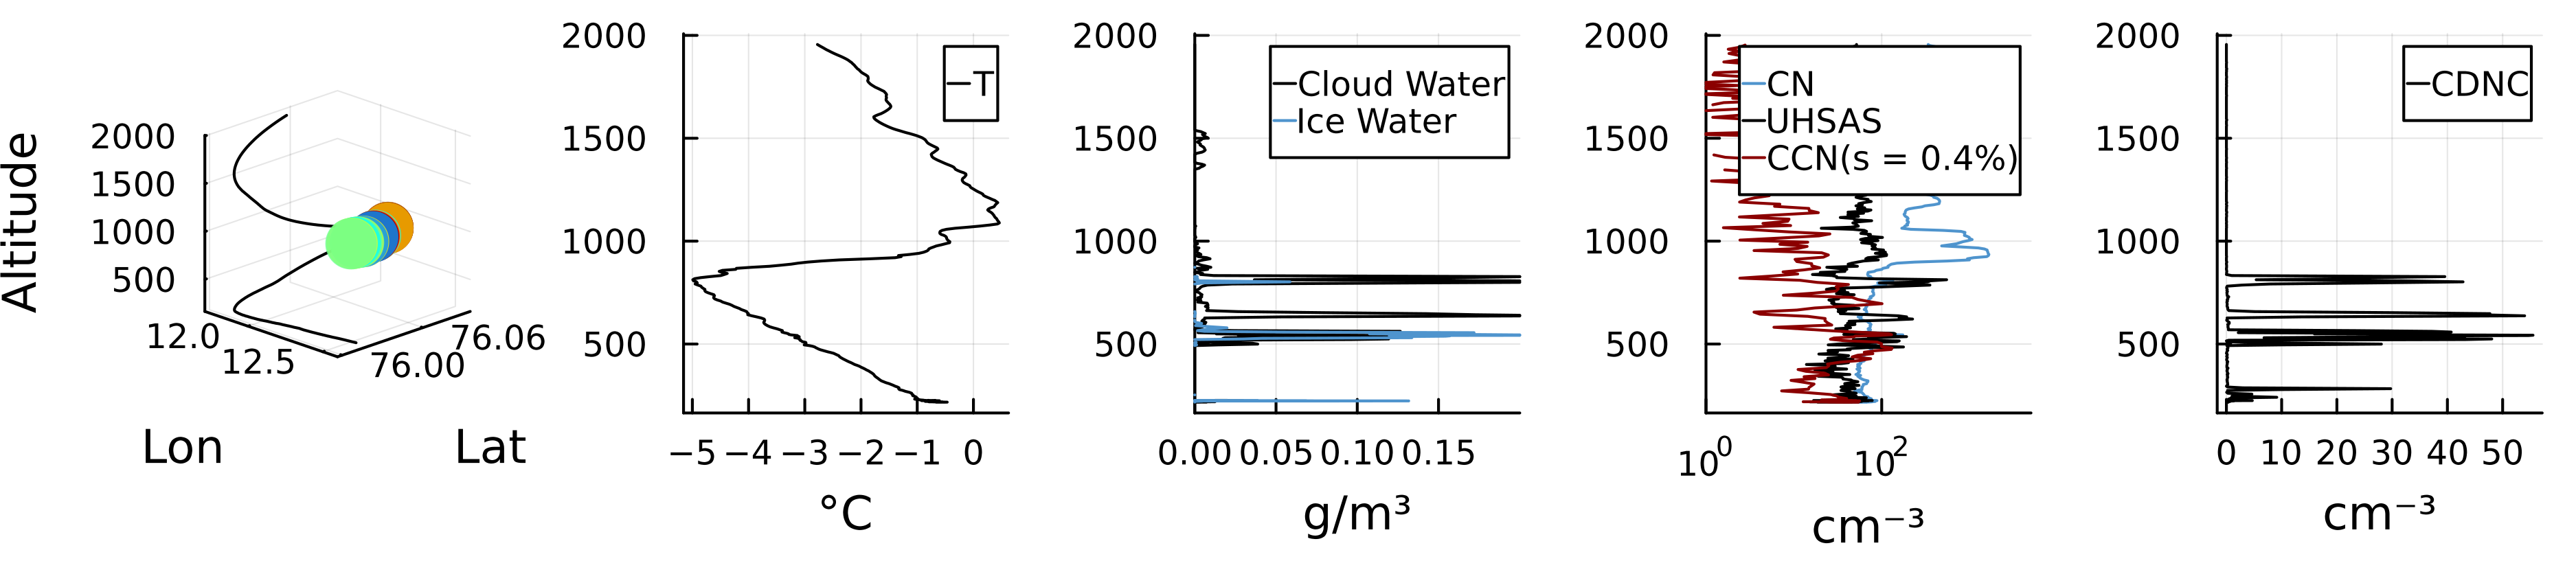
Figure 3. Left-to-right: (a) Aircraft altitude. Makers show the presence of cloud liquid water. (b) Vertical temperature profile. (c) Cloud water and cloud ice concentration. (d) Aerosol concentrations: CN: particle number concentration > 10 nm, UHSAS: particle number concentration > 60 nm, CCN: particles that serve as cloud condensation nuclei at 0.4% water supersaturation. (e) Hydrometeor number concentration measured by the cloud droplet probe.
The vertical profiles provide rich information about the thermal structure, the cloud structure, the distribution of liquid and ice inside the cloud, the aerosol concentration below and above the cloud, and the cloud microphysical properties (droplet number and droplet size). Notably, the temperature is seen to strongly increase with height at ~800 m altitude, which is the height of the temperature inversion that limits the cloud top height. This thermal stability is common in maritime environments at polar, mid-latitude, and subtropical latitudes.
Data from these profiles will be used to link aerosol properties, cloud properties, and precipitation rates via numerical model simulations. These efforts will help improve understanding about how these clouds form and dissipate and help improve weather forecasts made by numerical weather models.