Soot on Ice
Soot particles, or black carbon particles, are one of the most efficient light absorbing particles in the atmosphere. These particles have natural and anthropogenic sources. Natural sources are from wildfires, which are common in the boreal forests covering the northern latitudes. Human sources are associated with controlled combustion, including industrial emissions, car and ship exhaust, flaring of natural gas, household cooking, and heating.
While some black carbon is generated in the Arctic, most black carbon is transported to the Arctic through storm systems. The map below shows a snapshot in time of the lower atmospheric black carbon concentration. Note how the black carbon is localized in fronts that move through the atmosphere with weather systems.
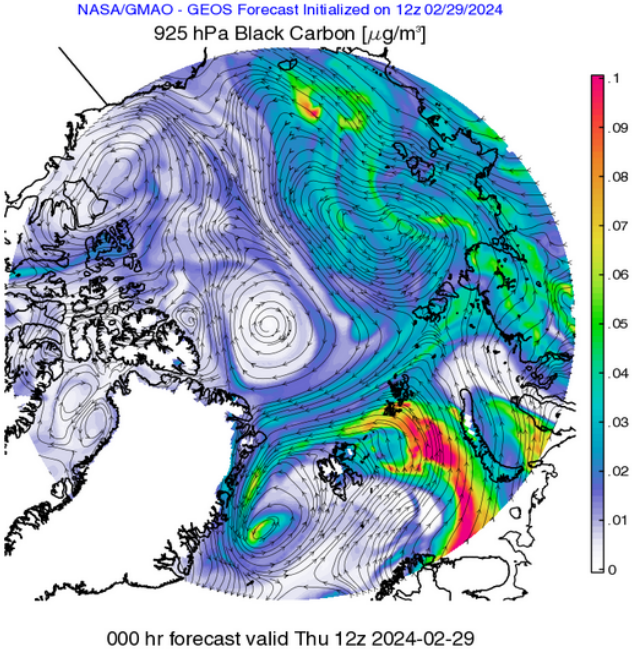
Figure 1. Black carbon concentrations in the lower atmosphere generated by the NASA Global Modeling and Assimilation Office. The large landmass on the bottom left is Greenland.
Once the black carbon reaches the Arctic their impact on the environment is complex. The black carbon particles may influence Arctic clouds by serving as cloud condensation nuclei or ice nucleating particles. When the sun is up, black carbon floating in the air absorbs solar radiation, causing additional warming of the Arctic atmosphere. Eventually, the black carbon particles will deposit on Arctic ice. Once contaminated with black carbon, the surface absorbs solar energy more efficiently and this causes the ice to melt earlier than it would have without black carbon. Combined, these effects contribute to accelerated warming of the Arctic and sea ice loss from a warming climate.
These are some of the reasons why our team is participating in CAESAR. During the first research flight we flew straight westward over the Norwegian Sea the Greenland Sea and then flying over the edge of the Greenland ice shelf.

Figure 2. Actual flight track of the C-130 aircraft sampling aerosol and clouds during CAESAR. The flight track to Greenland and back are on top of each other.
Approaching Greenland allowed us to sample particle concentrations in the boundary layer above the marginal ice zone, which is the gradual transition zone between the open ocean and the pack ice.
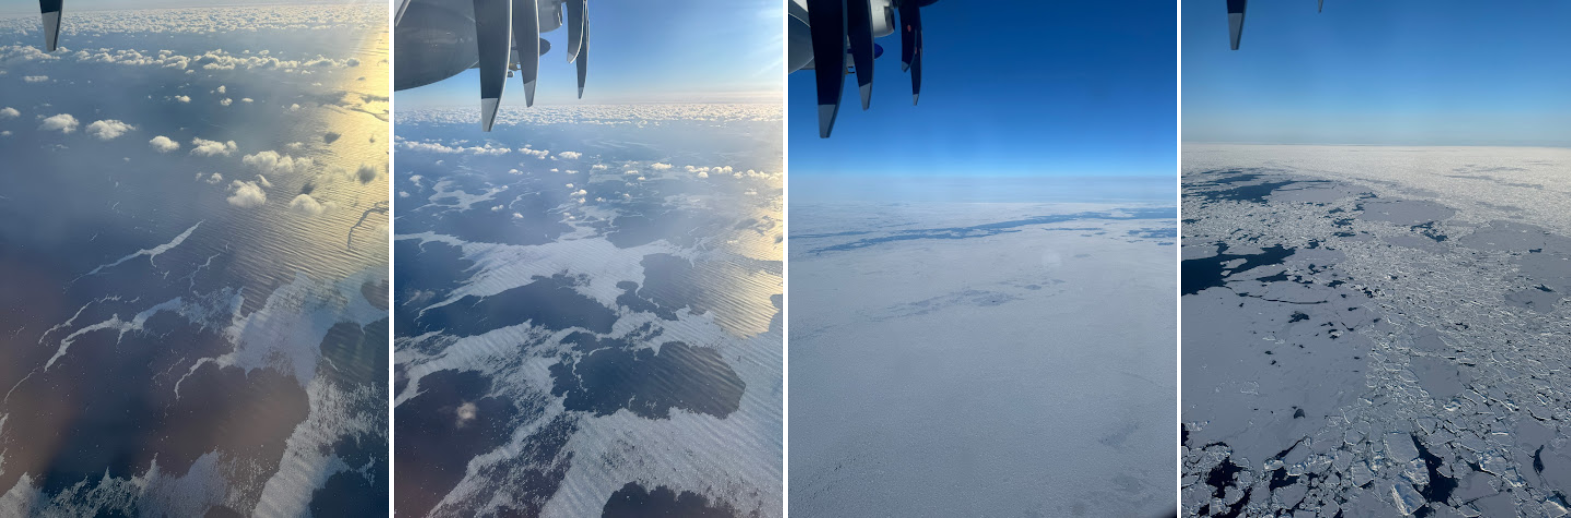
Figure 3. Photographs from the C-130 as the airplane crosses the marginal ice zone on it's flight toward Greenland. (Photos by Lintong Cai).
Video 1. Short video of the C-130 sampling aerosol in the boundary layer above the marginal ice zone. (Video by Lintong Cai).
On the way back we sampled aerosol at an altitude of 525 m above ground level for a period of 20 min. This is in the lowest layer of the atmosphere, the boundary layer, which is in contact with Earth surface. Black carbon number concentrations were ~3.3 cm⁻³. Note the gradual increase in temperature after 15:30, which corresponds to the transition from the pack ice to the marginal ice zone on the transit back from the ice toward Kiruna.
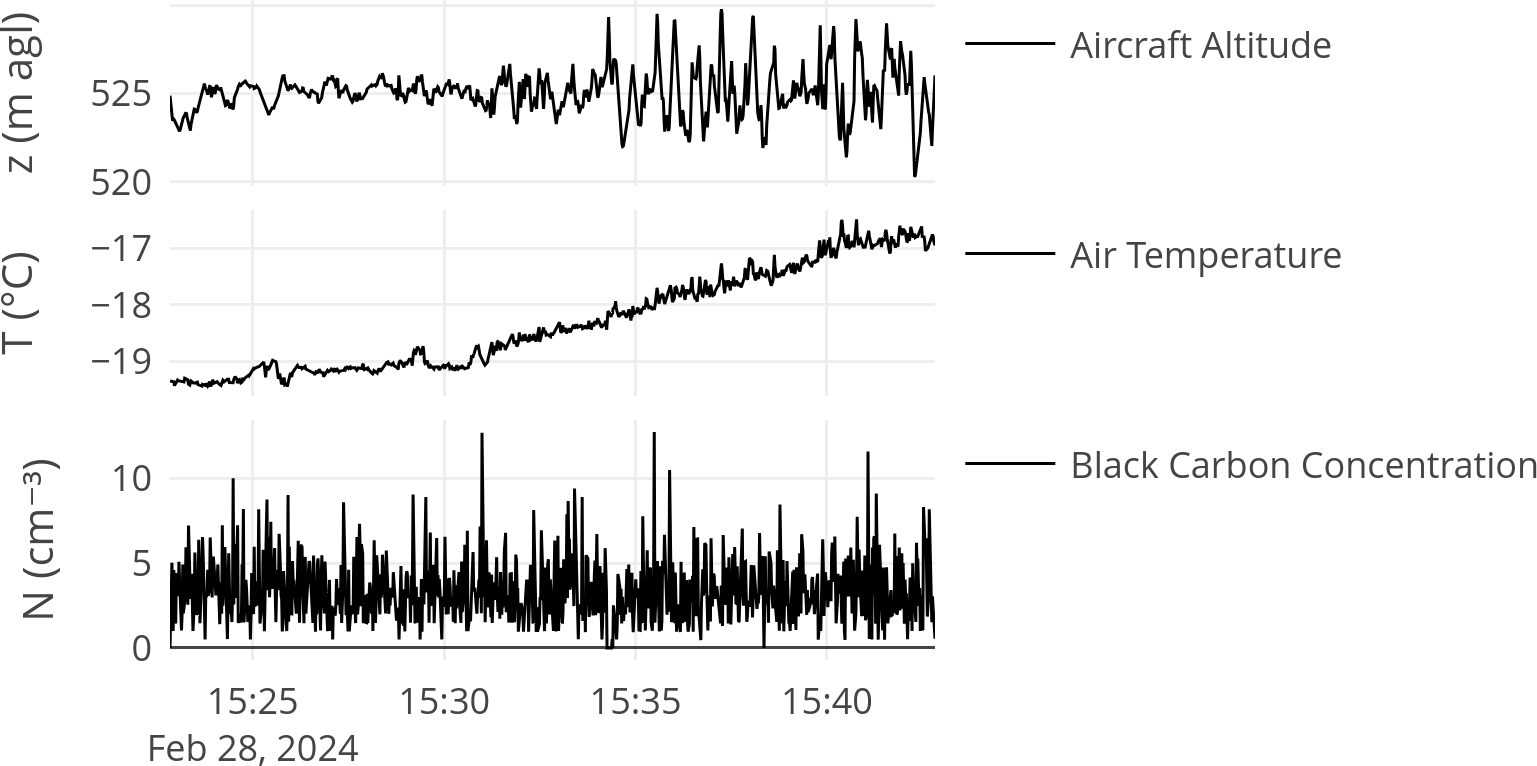
Figure 4. Measured black carbon concentration in the boundary layer across the transition between pack ice and the marginal sea ice zone. The flight direction is from the pack ice (earlier) toward open water (later).
Analyzing these data in more detail and across multiple research flights will help us understand gradients in the black carbon size distribution, the black carbon mass concentrations, the spatial distribution of black carbon, and local black carbon sources. Ultimately, these data will help to validate black carbon forecast models (e.g. Figure 1) and develop models to help us better understand the influence of black carbon on Arctic sea ice and Arctic warming.