What is Autoconversion?
The picture below shows a shallow cloud with rain falling from the center. Observations show that this type of rain can form within 30 min of the initial cloud formation. Autoconversion is the process that transforms small cloud droplets into larger rain drops that then fall out from the base of the cloud.
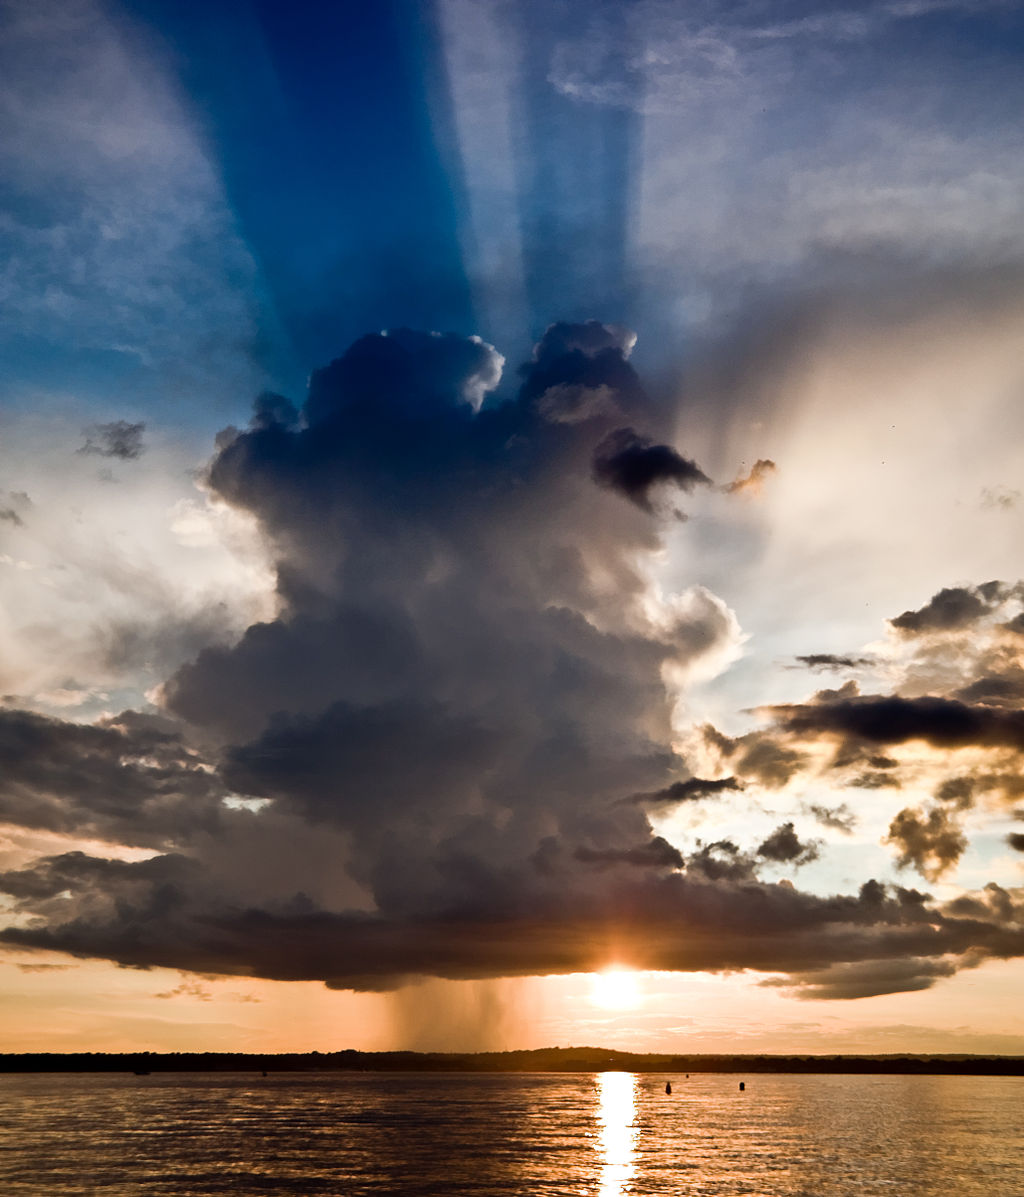
Figure 1. Cumulus with likely warm rain falling from the center. Image Credit: Versageek/CC BY-SA 3.0 via Wikimedia Commons.
Part 1: Representing Cloud Droplet Distributions
A cloud is made of a collection of tiny drops that are 1 to 50 μm in diameter. This is smaller than the width of human hair, which is ~70 μm in diameter. The collection of drops can be summarized as a distribution. Summing over the distribution gives the average number of droplets per unit volume. For example, a typical number concentration is 100 cm⁻³, or 100 droplets in a 1×1×1 cm box. The average droplet diameter μ gives the size of the most common droplets. The dispersion σ gives an approximate range of droplet sizes. The relative dispersion CV, denoting the coefficient of variation, is the ratio of σ/μ and gives the relative width of the distribution. Larger values for CV correspond to broader distributions. You can use the sliders below to explore how these terms change the distribution.c
On a piece of paper, predict/sketch how changing Nₜ, μ, and CV change the computed droplet size distribution.
Use the sliders to verify your prediction.
Evaluate the standard deviation σ for μ = 20 and CV = 0.2. Use the statistical definition of standard deviation to describe how this value relates to the width of the droplet spectrum.
Double-click on "S1" in legend. This will bring up an example cloud droplet spectrum from a stratocumulus cloud deck near the Canary Islands in Spain. Error bars are ±1 standard deviation expressing variability from pooling several spectra from different regions of the cloud. Use the sliders to find the best possible overlap between the model and the data. Record the values for Nₜ, μ, and CV.
Repeat this exercise for spectrum "S2".
Contrast the Nₜ, μ, and CV between "S1" and "S2". Write a short paragraph that quantitively summarizes the differences between the two spectra.
Advanced question: The spectrum "S1" corresponds to regions in the cloud where updraft velocities are higher while the spectrum "S2" corresponds to regions in the cloud where updraft velocities are lower. Propose a hypothesis that might explain the differences between S1 and S2.
Part 2: Rain Formation by Autoconversion
The distribtuion of cloud droplets evoles during autoconversion. Collisions of two droplets reduces cloud droplet number concentration. Collisions also produce drops of a larger size. The cloud liquid water content (LWC) is controlled mainly by thermodyamics. The combination of droplet concentration and LWC yields the mean droplet diameter. The CV value determines the dispersion of the distribution as in Figure 2.
Figure 3 highlights several important points. The initial transfer from cloud liquid water to rain liquid water is slow. Once the process reaches a critical point the cloud liquid water is rapidly converted to rain liquid water within a few 10s of minutes. Similarly, the diameter growth of the rain is at first low. However, near the critical point the average rainwater diameter rapidly grows to millimeter size in diameter, which is the characteristic diameter of rain drops during "moderate" rain. Similarly the number of rain drops first increases until it reaches a maximum. At the maximum self-collection of rain drops leads to growth in size and a decrease in their number.
The time to rain formation due to autoconversion depends on \(N_t\), LWC, and CV. Higher LWC results in faster rain formation. Clouds with higher number concentration develop precipitation more slowly. Finally, the broadness of the distribution, expressed by the CV value, also influences time to rain formation. Broader distributions lead to more rapid rain formation.
Prove to yourself that the model conserves liquid water.
Use the sliders to explore the influence of \(N_t\), LWC, and CV. Based on your exploration, rank the relative importance of \(N_t\), LWC, and CV on the time to rain formation.
Propose an explanation why an increase in \(N_t\) will decrease the precipitation efficiency of a cloud.
Advanced question: Propose an explanation on how atmospheric aerosol might influence rain formation via autoconversion.
Part 3: Math Stuff
It is desirable that the size distribution remains describable by a single mathematical function during the entire process. This is called the main function approach. The Gamma distribution probability density function is suitable to characterize autoconversion.
where \(A\) (\(cm^{-3}\; g^{1-\nu}\)), \(\nu\; (-)\), and \(B\;(g^{-1})\) are parameters of the distribution, and \(x\) is the mass of the drop. The distribution \(f(x)\) has units of \(cm^{-3}\). The integral \(\int_0^\infty f(x)dx\) equals the liquid water content in gram per cubic centimeter of air. A triplet of values for \(A\), \(\nu\), \(B\) can be fitted to describe a measured hydrometeor distribution.
While the function above is written in terms of hydrometeor mass, measurements are often in terms of hydrometeor diameter, as shown in Figure 2. The parameters of the mass-based Gamma distribution function can be obtained from the inputs to Figure 2 \(N_t\), \(\mu\), and \(CV\) through mathematical transformation. The \(\nu\) paremeter determines the width of the distribution and thus affects the autoconversion rate. It is related to the coefficient of variation via \(\nu \approx 0.112/CV^2 - 1\), which is a relationship similar to that in Eq. 14 of Austin et al. (1995).
Part 3: References
Austin, P., Y. Wang, V. Kujala, and R. Pincus, 1995: Precipitation in stratocumulus clouds: Observational and modeling results. J. Atmos. Sci., 52, 2329–2352, doi:10.1175/1520-0469(1995)052,2329:PISCOA.2.0.CO;2.
Snider, J.R. and Brenguier, J.-L. (2000), Cloud condensation nuclei and cloud droplet measurements during ACE-2. Tellus B, 52: 828-842. https://onlinelibrary.wiley.com/doi/abs/10.1034/j.1600-0889.2000.00044.x.